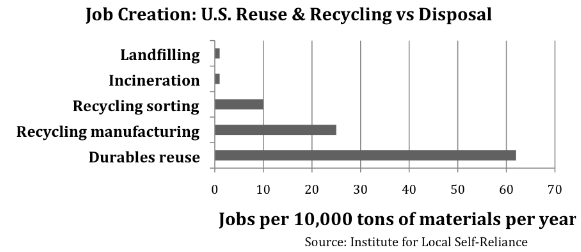
Job Creation: Reuse and Recycling vs. Disposal
discarded material per year |
|
|---|---|
| Product Reuse | |
| Computer Reuse | 296 |
| Textile Reclamation | 85 |
| Misc. Durables Reuse | 62 |
| Wooden Pallet Repair | 28 |
| Recycling-based Manufacturers | 25 |
| Paper Mills | 18 |
| Glass Product Manufacturers | 26 |
| Plastic Product Manufacturers | 93 |
| Conventional Materials Recovery Facilities (recycling sorting centers) | 10 |
| Composting | 4 |
| Landfill and Incineration | 1 |
Note: Figures are based on interviews with select facilities around the country. Source: Institute for Local Self-Reliance, Washington, DC, 1997.

Newer data from ILSR’s 2013 report on composting in Maryland affirms this:
Jobs, Composting vs. Disposal in MD
|
Type of Operation |
Jobs per 10,000 tons/year | FTE Jobs/$10 Million Invested |
| Composting Sitesa |
4.1 |
21.4 |
| Compost Use |
6.2 |
n/a |
| Total Composting & Compost Use |
10.3 |
|
| Disposal Facilities | ||
| Landfilling |
2.2 |
8.4 |
| Burning (with energy recovery) |
1.2 |
1.6 |
a Includes mulching and natural wood waste recycling sites.
TPY = tons per year (of material composted)
FTE = full-time equivalent
Incinerator data based on Eileen Berenyi, Governmental Advisory Assoc. Inc., 2012-2013 Municipal Waste to Energy in the United States Yearbook & Directory. Westport, Connecticut. 2012.
Source: Pay Dirt: Composting in Maryland to Reduce Waste, Create Jobs & Protect the Bay, Institute for Local Self-Reliance, 2013.
Potential New MD Jobs By Composting 1 Million Tons of Organics
| Option |
FTE Jobs |
| Burning |
120 |
| Landfilling |
220 |
| Composting |
740 |
| Compost Use |
620 |
| Total Composting |
1,360 |
FTE = full-time equivalent
Composting jobs based on one-third tonnage composted at small facilities, one-third at medium-sized facilities, and one-third at large facilities. Compost use jobs based on data from 13 companies using compost for soil erosion control, stormwater management, and other green infrastructure applications.
Source: Pay Dirt: Composting in Maryland to Reduce Waste, Create Jobs & Protect the Bay, Institute for Local Self-Reliance, 2013.

