Vote for us on the EPA Apps for the Environment Contest
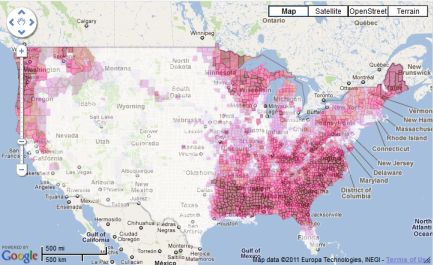
I entered our Energy Justice Communites Maps as a submission to "Apps for the Environment".
You can Vote for Us and help us promote our cause!
Shale Gas Outrage - Protest and Conference - Sept 7 and 8 in Philadelphia
Energy Justice will be participating in the Shale Gas Outrage protest on Sept 7 and the one-day conference on Sept 8.
We will be giving a workshop (from 10:45-12) and tabling. Drop by and say hello!
Our workshop:
Mapping and Fighting Demand for Natural Gas: Power Plants and LNG Exports
Mike Ewall, Aaron Kreider & Amy Wilson
Energy Justice Communities Map - Intro Video
I just did a short introduction video to our EJ Communites Map website.
Faster and Easier Facility Layers
I'm happy to announce a redesign of the facility layers system which makes it faster and easier to use.
This affects the National Map, Community Map, State Map, and Global Map.
Mapping CO2 Emissions
The Vulcan Project has done extensive research into US CO2 emissions. They've broken down the US into small grid squares (10 km by 10 km) and estimated *hourly* emissions for an entire year (2002)!
Now that data set is crazy huge (5 GB)! Fortunately, they've released the results for the entire year by county.
We have converted this data into KML layers which you can download and add to your own maps.
Flywheel energy storage makes 100% wind and solar possible
We can meet all of our electricity needs with wind and solar. But what about when the wind isn't blowing and the sun isn't shining? Coal, nuclear and natural gas make up 88% of the U.S. electricity mix. There are several answers to the myth that intermittent energy sources like wind and solar can't replace these dirty energy sources. One of the most exciting is flywheel energy storage, now being pioneered on a commercial scale in New York and soon Pennsylvania. Check it out...
Frictionless future for energy
Biomass Potential Layers
I added biomass potential layers from the NREL biomass 2008 data set.
You can see them on our National Map.
For instance you can see a map of Forest Residue (dry tons per square mile).
You can click on the layer to get the underlying data value.
Burn that residue before the forest gets a chance to grow back!

Sharing Our Data in KML
I created a page to share our data in KML.
KML is a good format for sharing data. You can use a KML file in Google Maps API or you can import it into your own map with the (easier to use) Google - My Maps.
This American Life Covers Fracking in PA
Check out This American Life episode 440: “Game Changer.” <–link

